How to calculate the cost of re-keying data between city systems
A simple worksheet for putting a number on manual data entry between systems: staff time, error correction, delay and risk. Use your own figures to build the case for automation, or against it.
Almost every city has a person who reads one screen and types into another. Permit details into the GIS layer. Payment totals into the ledger. New hires into payroll. The work is real, it is usually invisible in the budget, and it is hard to argue about without a number.
This post walks through a simple worksheet. It uses your figures, not industry averages, so the result is something you can defend to a finance director or a council.
Step 1: list the re-keying tasks
Walk through each department and ask one question: "What do you copy from one system into another?" Write down every answer, even small ones. For each task, note:
- The source system and the destination system.
- Who does it, and how often: daily, weekly, per record.
- Roughly how many records or entries each time.
- What happens when it is late or wrong.
Ask the people doing the work, not their managers. They know about the spreadsheet that bridges the two systems, and the extra check they do every Friday.
Step 2: measure the time per record
Time it rather than guess. Sit with the person for a normal session and count records and minutes. Include the parts people forget:
- Opening both systems and finding the record.
- Looking up codes that don't match between systems.
- Checking the work, or having someone else check it.
- Fixing records that bounced back.
Divide the minutes by the records to get minutes per record.
Step 3: put a cost on the hour
Use a fully loaded hourly cost: salary plus benefits and overhead. Your finance or HR office usually has a standard figure for budgeting. Use theirs, so nobody argues about the rate.
Step 4: do the arithmetic
The basic formula is:
records per year  x  minutes per record  /  60  =  hours per year
hours per year    x  loaded hourly cost         =  direct cost per year
Here is a worked example with made-up numbers, just to show the shape:
| Item | Example value |
|---|---|
| Permits copied to the GIS layer each week | 60 |
| Weeks per year | 50 |
| Minutes per permit, including checks | 4 |
| Hours per year | 200 |
| Loaded hourly cost (your figure) | $50 |
| Direct cost per year | $10,000 |
Replace every number with your own. The point is the method, not the result.
Step 5: add the costs that don't show up on a timesheet
Direct time is only part of it. Add a line for each of these, even if it is a rough estimate.
Errors
How many entries are wrong, and how long does each take to find and fix? A transposed digit in a payment can take far longer to trace than it took to type.
Delay
If the GIS layer is updated weekly instead of nightly, who is working from old information? Inspectors, call takers and residents all feel delay, even if nobody bills for it.
Coverage
What happens when the one person who knows the task is on leave? Backlogs, overtime, or work that simply stops are all real costs.
Risk
Re-keying personal data means more people handling it, more exports on shared drives, and more chances for something to end up in the wrong place.
Step 6: compare with the cost of automating
Automation is not free either. Be honest about its side of the ledger:
- Software or subscription cost.
- Staff time to build and test the flow, and to maintain it.
- Vendor or consultant time, if any.
- Time to monitor runs and handle exceptions.
Some tasks will not be worth automating. A task that takes ten minutes a month and rarely goes wrong can stay manual. The worksheet is as useful for ruling things out as for ruling them in.
Step 7: present it plainly
A one-page summary works best:
- A table of tasks, with hours per year and direct cost.
- A short list of the non-time costs, described in words.
- The top three tasks to automate first, and why.
- What staff would do with the time instead.
That last line matters. Automation rarely removes a position. It usually moves people from typing to the work only they can do, such as reviewing exceptions or helping residents.
Keep measuring after go-live
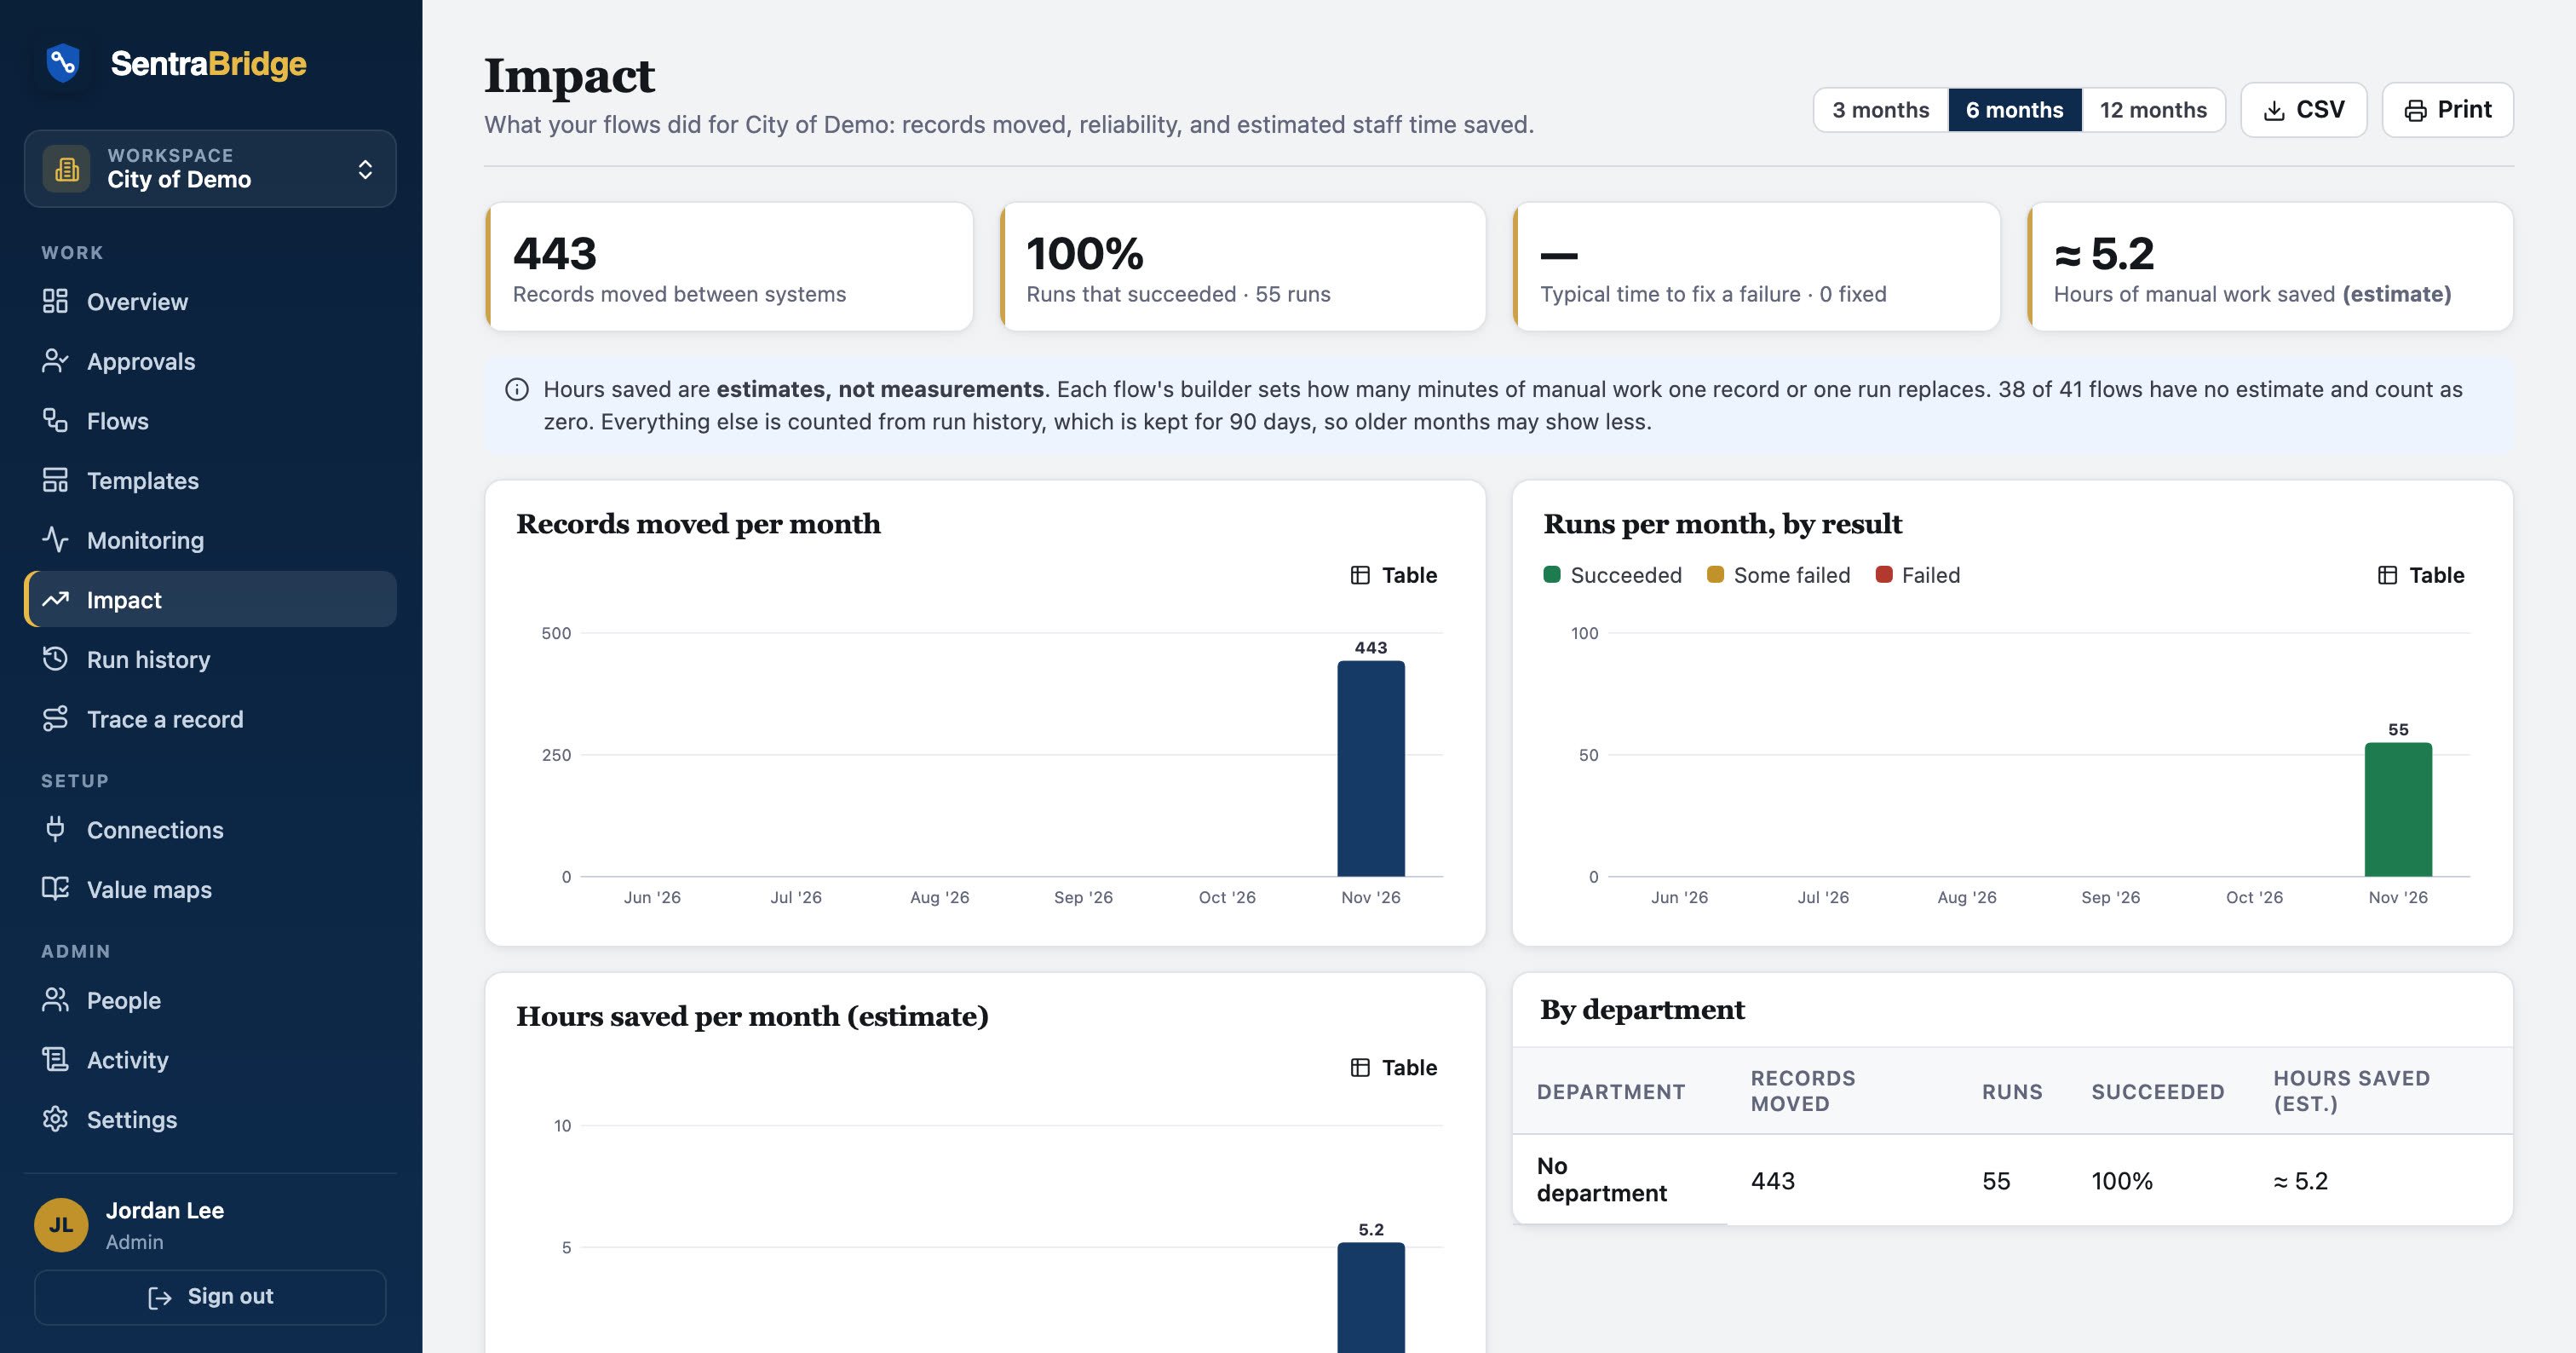
Once a task is automated, keep the same measures: records moved, failures, time to fix. That lets you show the result a year later with real numbers, instead of the estimate you started with.
In SentraBridge, the Impact report shows records moved, success rate and time to fix by month and department. Each flow can carry its own estimate of minutes saved per record, and the hours-saved figure is always labelled as an estimate. Read more under monitoring, or browse live examples of the tasks cities most often automate first.