
Data inspection before you integrate
Most integration problems are data problems: blank fields, odd formats, unexpected codes. Looking at real records at every step before you go live catches them early.
Ask anyone who has run a city integration project where the time went. It rarely went into connecting the systems. It went into discovering what the data really looked like: the phone numbers with extensions, the dates in three formats, the addresses with no ZIP, the status code nobody remembered adding.
Documentation describes the data as it should be. Inspection shows it as it is.
What to look for
When you look at real records from a source system, check these first:
- Blank required fields. How many records have no address, no email, no parcel number?
- Formats. Are phone numbers
5592517767,(559) 251-7767or559.251.7767? Are dates ISO, US-style or text? - Codes. Which status, type and department values actually appear? Are there codes the destination won't accept?
- Nesting. Are addresses or contacts lists inside the record rather than simple fields?
- Duplicates. Does the same record appear twice in one read?
- Volume. How many records change in a normal hour, day or week?
Every one of these becomes either a rule in your flow or a question for the system owner.
Look at every step, not just the ends
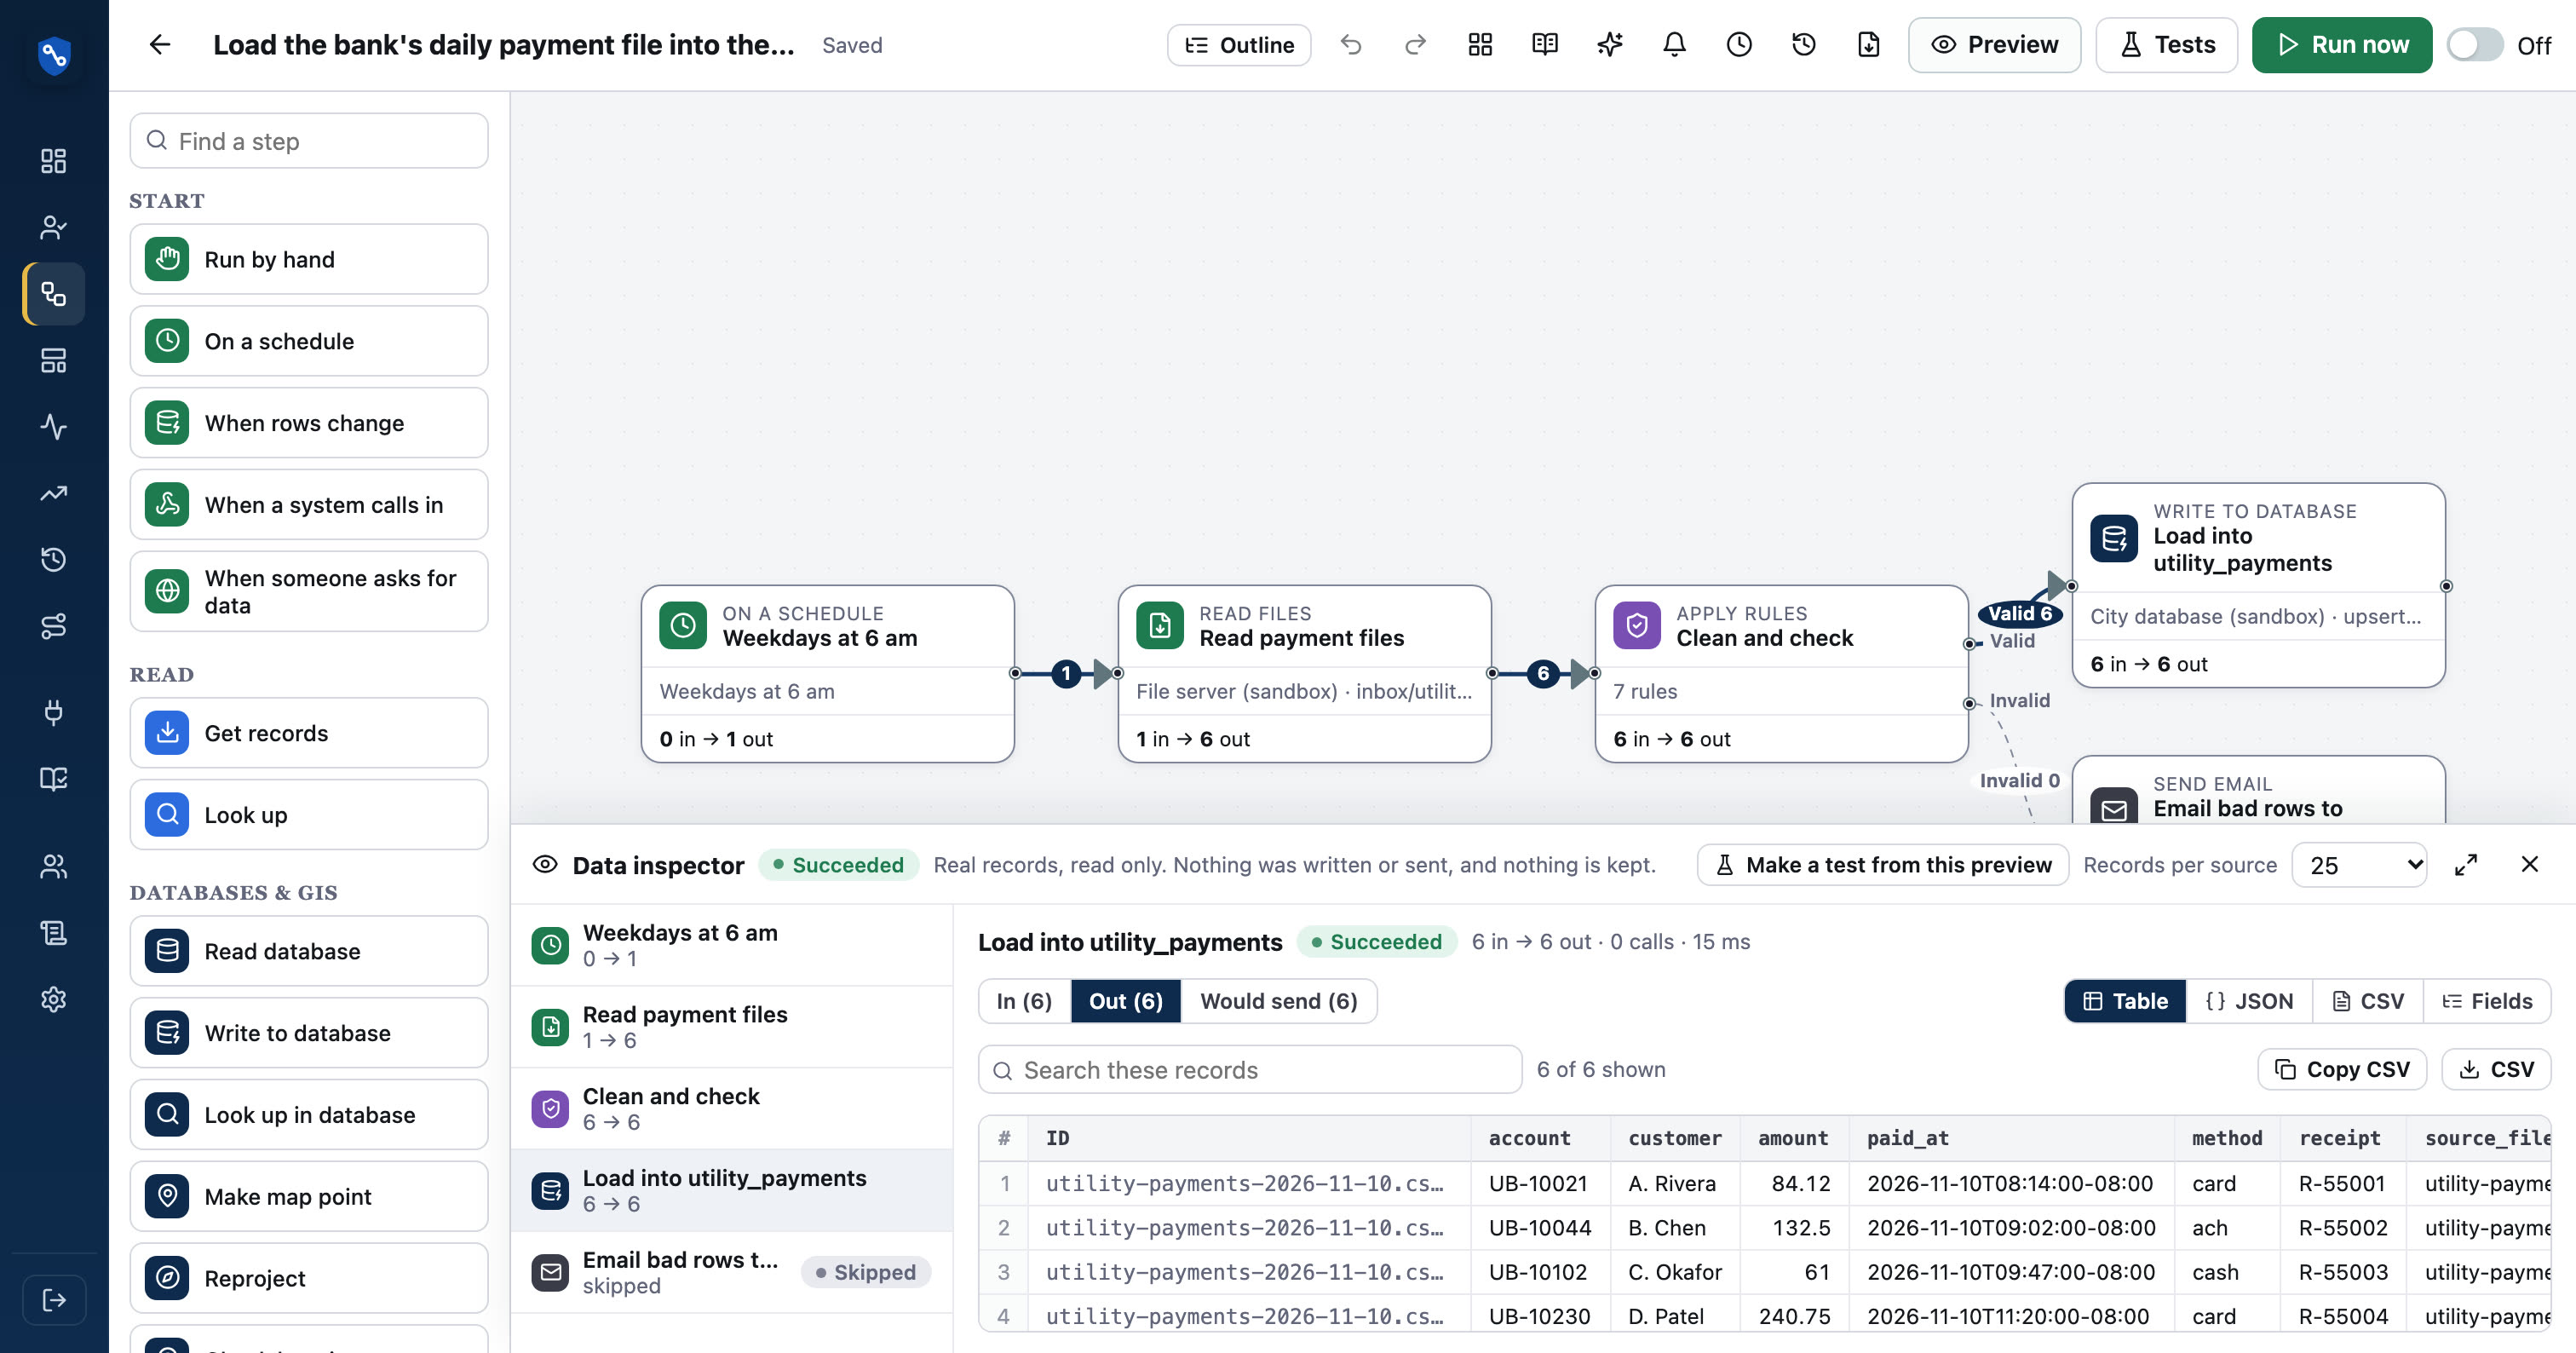
A flow changes data as it goes. A filter drops records, a map renames fields, a rule cleans values, a branch splits them. If the output is wrong, you need to know which step made it wrong.
Data tools used by GIS teams have done this for years: every connection between steps shows how many features passed through, and you can open it to see them. That idea works just as well for city records.
A practical inspection routine
- 01Read a sample5, 25 or 100 real records
- 02Scan the tableBlanks, formats, odd values
- 03Field summaryCounts of each value per field
- 04Follow the wiresSee what each step kept or dropped
- 05Add rulesClean and check what you found
Start small
Read five records, then twenty-five. Patterns that hide in five records often show up in twenty-five.
Use the field summary
A table is good for reading records. A summary is better for spotting problems: how many blanks per field, and which distinct values appear. That's where the unexpected status code shows up.
Follow the counts
If 25 records go into a filter and 3 come out, is that right? If a branch sends everything to "No", the rule is probably comparing the wrong field.
Look at what would be sent
The most useful view is the last one: the exact body that would be sent to the destination. Compare it with the destination's documentation before anything is written.
Turn findings into rules
Each problem you find should become something the flow handles every time:
- Formats become cleanup rules: phone numbers, dates, ZIP codes, extra spaces.
- Required fields become checks, with failing records sent to a separate output.
- Codes become value maps, translating one system's codes to another's.
- Duplicates get a remove duplicates step.
Records that fail checks should go somewhere visible, such as an email to the data team, rather than being dropped quietly.
Inspect again after go-live
Data changes. A new request type is added, a vendor update changes a date format, a department is renamed. Keep a habit of opening the inspector when a flow's counts look different from usual, and when records start failing checks. The field summary will usually show the new value within a minute of looking.
How SentraBridge does it
SentraBridge's data inspector shows record counts on every wire. Click a wire to see the records on it, as a table, JSON, CSV or a field summary, with 5, 25 or 100 records per source. Preview runs the flow on real records in memory and shows what each step received and what it would send. It never writes, sends or keeps anything.
From there, the Apply rules step turns what you found into clean-and-check rules with Valid and Invalid outputs. More on the data inspector page.